The brief
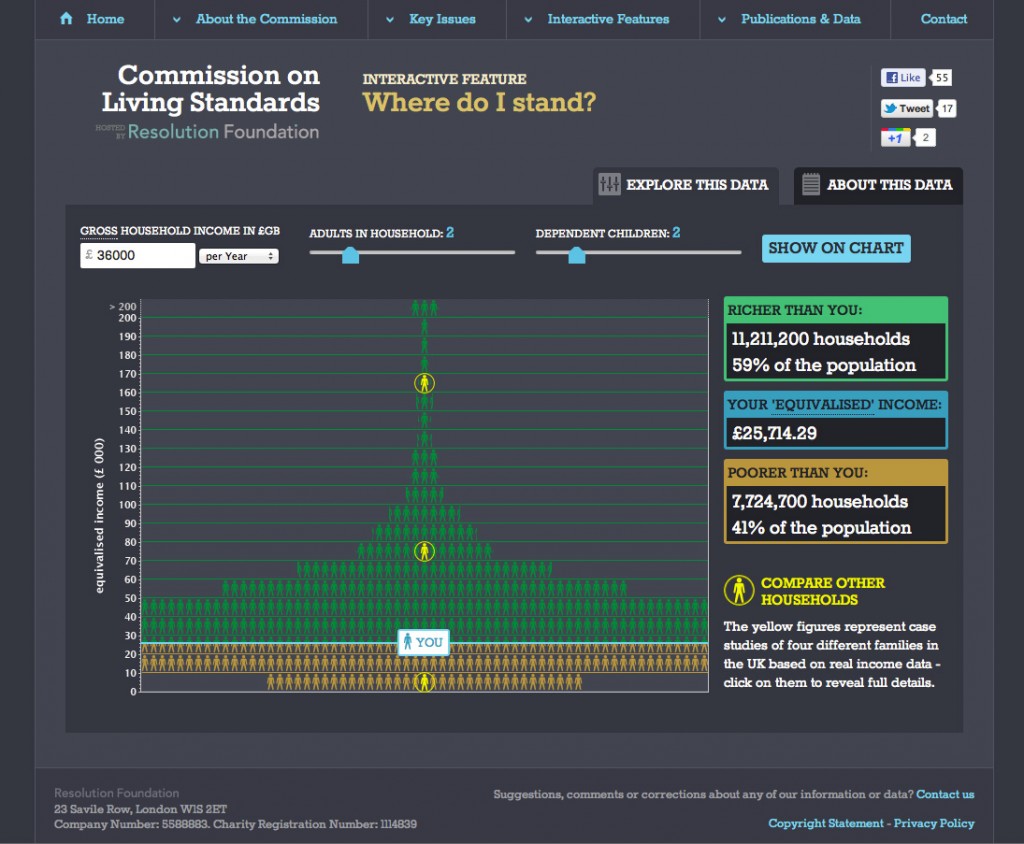
The Commission on Living Standards is an independent research project, hosted by the Resolution Foundation think-tank and set up to investigate the economic stagnation of low to middle income Britain over recent decades. They asked us to create a website where they could present a general overview of the project and its key issues, as well as more technical and detailed information, including charts and specific publications. Most importantly they wanted to turn some of this data into a couple of interactive features that would allow users to appreciate and visualise the issues more readily. The first of these, “Where do I stand” allows users to enter details about their own household (income, number of adults, children) and immediately see their position among the population in general in a population pyramid-type diagram. The second, “Winners and losers” allows a quick comparison of how earnings have changed for different sectors of population year-on-year over the past 30+ years.
What we did
Dynamic charts
The biggest challenge – and achievement – on the site was the dynamic charts. We needed them to be clear, intuitive and enjoyable to use, and from a technical point of view based on live data in spreadsheets that could be altered and added to by the Commission without specialist technical knowledge. Naturally, the charts also needed to be compatible across different browsers and devices, including older versions of Internet Explorer, yet the traditional fallback method (Flash) was no longer a serious option because of its incompatibility with Apple’s increasingly ubiquitous iDevices. We achieved our goal with a combination of HTML5 and custom-written Javascript (notably making use of the excellent Highcharts library). The page reads the data live from an automatic feed in a Google Docs Spreadsheet, so any changes made to this data are immediately reflected on the live charts. A rigorous session of cross-browser testing and tweaking guaranteed they were ready to go.